Table of Contents
- The short version
- What Is a Shack Dashboard?
- HamClock by WB0OEW
- Key Features
- Display Modes and Customisation
- Platforms and Installation
- Installation on the Raspberry Pi
- Data Sources
- What happened in 2026, and what you have to do
- Three roads out of HamClock 4.22
- OpenHamClock: not a fork but a new build
- Practical Daily Use
- Setup for Austrian Locations
- Alternatives to HamClock
- Hardware Costs and Setup
- Tips for Optimal Use
- Conclusion: A Must-Have for Every Shack
- Sources and further reading
- Image credits
- Correction notice
- Transparency Notice
Every operator knows the routine: you sit down at the rig ready to work HF and wonder — what are the propagation conditions right now? When is the next grey line? Where are the DX spots? What is the K-index doing? Instead of flicking between half a dozen websites, there is an elegant solution: HamClock. This free dashboard shows all relevant information for radio amateurs at a glance — on a dedicated screen right next to the transceiver.
The short version
- HamClock's creator Elwood Downey, WB0OEW, died on 29 January 2026. Version 4.22 is the last one from his hand.
- His server at clearskyinstitute.com has been offline since June 2026. Without a switch, an old HamClock stays blank.
- The community server hamclock.com run by W4BAE has taken over. One command is enough to switch.
- Two successor projects are ready to use: HamClock-Next (C++/SDL2) and OpenHamClock (browser).
- The hardware stays the same: Raspberry Pi plus a 7-inch display, roughly 100 to 150 euros.
What Is a Shack Dashboard?
A shack dashboard is a permanently running information display that presents all data relevant to operating in real time. Rather than checking individual data sources manually, the dashboard presents an aggregated view: world map with day/night terminator, solar data, band predictions, DX cluster spots, satellite passes and more. The concept is not new — many hams have always run a second monitor with information. HamClock has perfected this concept, combining everything in a single, highly optimised application.
HamClock by WB0OEW
HamClock was developed by Elwood Downey, WB0OEW — an experienced software developer and radio amateur. The application is free, open source and continuously improved. At its centre is a world map (Mercator or azimuthal projection) with a real-time day/night terminator, onto which numerous information layers can be overlaid.
Elwood Downey died on 29 January 2026. Version 4.22 is the last one he released. What he left behind runs in thousands of shacks worldwide and still sets the standard. What happened next is further down.
The core idea: you configure your own location (DE — "Home QTH") and optionally a target location (DX). HamClock then permanently shows the great-circle path between both locations, the current grey line, sunrise/sunset times and the optimum propagation conditions for this path.
Key Features
HamClock offers an impressive wealth of information arranged in configurable panels around the world map:
- World map with day/night terminator: Real-time display of the illuminated and dark halves of the Earth. The grey-line zone — the transition area between day and night where particularly good DX conditions prevail — is clearly highlighted.
- Solar data (space weather): SFI (Solar Flux Index), SSN (Sunspot Number), K-index, A-index, Bz component of the interplanetary magnetic field — all values needed to assess propagation conditions, sourced from NOAA in real time.
- Band predictions: Colour-coded display of VOACAP predictions for each amateur band between DE and DX — so you can see immediately which band should be open.
- DX cluster spots: Live spots from the DX cluster displayed directly on the world map. At a glance you can see where stations are being worked — ideal for DX operation.
- Great-circle path: The shortest radio path between DE and DX is drawn on the map — with distance, bearing and signal travel time. Both short path and long path are shown.
- Satellite tracking: Real-time tracking of amateur radio satellites with pass times, elevation and frequencies — based on current TLE data.
- POTA and SOTA spots: Active POTA and SOTA activations displayed directly on the map or in a dedicated panel.
- Moon and Sun: Position, phase and rise/set times — relevant for EME (Earth-Moon-Earth) and grey-line timing.
- Weather data: Local weather at your own location and at the DX location.
- UTC and local time: Always in view — essential for radio operation.
Display Modes and Customisation
HamClock supports various resolutions — from 800x480 pixels (perfect for a 7-inch RPi display) up to 3200x1920 for large monitors. The panels around the map can be individually configured: you choose which information appears in which panel. Some users run two or three HamClock instances side by side on a widescreen monitor.
The map projection can be switched between Mercator and azimuthal. In azimuthal view your own location is at the centre — ideal for intuitively grasping directions and distances. Various map styles (political, topographic, dark) are available.
Platforms and Installation
HamClock runs on a wide range of platforms:
- Raspberry Pi with 7-inch touchscreen: The most popular setup. An RPi 4 or 5 with the official 7-inch display makes a compact, dedicated shack dashboard. Touchscreen operation makes mouse and keyboard unnecessary. Total cost: around 100 euros.
- Linux (desktop): Compilable on any Linux system. Ideal if you want to use a second monitor on the shack PC.
- macOS: Native application, runs on Intel and Apple Silicon Macs.
- Windows: Via the bundled Windows version or through WSL (Windows Subsystem for Linux).
- ESP32/ESP8266 with small TFT: A mini version for particularly compact builds — limited functionality but perfect as a small supplementary display.
Installation on the Raspberry Pi
Installation on the Raspberry Pi is straightforward:
- Install Raspberry Pi OS (Lite or Desktop — HamClock provides its own graphics)
- Download HamClock: no longer from clearskyinstitute.com, that site is offline. The package now comes via hamclock.com.
- Compile: Build the desired version with make (e.g. hamclock-fb0 for framebuffer without desktop environment, or hamclock-web for web interface)
- Configure: On first launch, enter your callsign, grid locator (e.g. JN77 for Carinthia or JN78 for Vienna) and time zone
- Network: HamClock requires an internet connection to fetch data from NOAA, DX cluster, VOACAP and other sources
After initial configuration, HamClock starts automatically and cyclically updates all data. The Raspberry Pi runs 24/7 with minimal power consumption (around 5 watts) — perfect as an always-on dashboard.
Video tip: an installation walkthrough that is current for 2026, meaning it uses the new server.
Data Sources
HamClock aggregates data from a wide range of sources — automatically and without manual configuration:
- NOAA Space Weather Prediction Center: SFI, SSN, K-index, A-index, Bz, proton flux, X-ray flux — the foundation for assessing solar cycle activity
- DX cluster via Telnet: Live spots of DX stations worldwide, displayed directly on the map
- PSKReporter: Shows where digital signals (FT8, FT4, CW) are currently being decoded — a real-time propagation map
- VOACAP: Propagation predictions for the DE–DX path, by band and by hour
- POTA/SOTA APIs: Active activations from Parks on the Air and Summits on the Air
- Satellite TLE: Current orbital data for amateur radio satellites (CelesTrak)
- Weather services: Local weather via Open-Meteo or similar APIs
What happened in 2026, and what you have to do
This is the part that makes every older guide on the web obsolete.
HamClock does not fetch its data from NOAA, the DX cluster and the rest by itself. A server sits in between, collecting and preparing everything and feeding it to the clocks. That server ran at Elwood Downey's Clear Sky Institute. After his death in January 2026 it was clear nobody was paying for it any more, and in June 2026 it went offline for good.
A HamClock still pointing at the old address has shown an empty map ever since. The software runs, the data simply no longer arrives.
The fix is hamclock.com. W4BAE set up a replacement backend serving the same data. Two ways to get there:
- Automatic:
curl -fsSL https://hamclock.com/tools | sudo bash - By hand: append
-b hamclock.com:80to the launch command
After that the old HamClock carries on as if nothing had happened. Running it costs real money every month, according to the operator; HamClock Classic stays free, funded through a paid Fire TV app and donations. Anyone using the dashboard daily may take that as an invitation.
Three roads out of HamClock 4.22
Starting from scratch today, you have three options. All three are free and open source.
- HamClock Classic 4.22 plus hamclock.com. Elwood's original, unchanged, with a new backend. Upside: exactly the familiar interface, and every older guide applies again. Downside: the code is no longer developed.
- HamClock-Next. A rewrite in C++20 with SDL2, maintained by K4DRW. It claims full feature parity with 4.22, meaning all 82 original features, and adds multi-display operation, a web view and extended weather data. Runs on Linux, macOS, Windows and in the browser, from a Raspberry Pi 3 upwards. Basic operation needs no server of its own.
- OpenHamClock. The clean break with the past, and the most modern approach. More on that next.
OpenHamClock: not a fork but a new build
One widespread misunderstanding first: OpenHamClock is not a fork of HamClock. It shares not a single line of code with the original. It is a complete reimplementation that explicitly set out to carry on Elwood's legacy once it became clear the original would stop in June 2026.
Technically the two are worlds apart. The original is a C++ program drawing straight to the screen. OpenHamClock is a Node.js application with a React interface: you install it once on a Raspberry Pi, an old PC or in the cloud, then open it in a browser. From any device on the network: a tablet at the operating position, a second monitor, a phone, a wall display.
What OpenHamClock brings:
- DX cluster, space weather and propagation forecasts like the original
- POTA, SOTA, WWFF and WWBOTA: live activations from all four programmes
- PSKReporter and WSJT-X integration: your own decodes feed straight into the dashboard
- Rig control: the transceiver frequency appears in the browser
- A logbook in the browser and a dedicated emergency communications mode
- Satellite tracking with current orbital data
The source lives on GitHub. We run an open instance ourselves at openhamclock.oeradio.at, so you can look around without installing anything. The detailed guide is in our article on OpenHamClock for browser and shack.
Which one? If you want a dedicated display next to the radio and value the familiar look, stay with HamClock Classic or move to HamClock-Next. If you want the dashboard on several devices at once and care about a logbook and rig integration, take OpenHamClock. Running both is no mistake either; the hardware is bored anyway.
Practical Daily Use
HamClock is more than a pretty gadget — it is a genuine operating tool. Here are some typical scenarios:
- Before switching on the transceiver: A glance at HamClock instantly shows whether it is worth getting active on HF. High SFI and low K-index? The higher bands could be open. K-index above 4? Better stay on the lower bands or switch to VHF.
- Grey-line DX: HamClock shows precisely when your own location and the DX target are simultaneously in the grey line. These short windows — often just 15 to 30 minutes — offer exceptional DX opportunities, particularly on the lower bands (80 m, 40 m).
- Contest preparation: Before a competition, plan optimal operating times for different directions. When is Japan reachable? When South America? The band predictions and terminator help with strategy.
- DX cluster monitoring: Active spots are shown on the map — you can immediately recognise cluster activity in specific regions and turn your beam accordingly.
- POTA and SOTA hunters: Keep active activations in view without constantly checking the POTA/SOTA website.
Setup for Austrian Locations
For radio amateurs in Austria the configuration is particularly interesting. The grid locator for most Austrian QTHs lies in the JN77 (Carinthia, Styria) and JN78 (Vienna, Lower Austria, Upper Austria) area. After entering your locator, HamClock displays grey-line times for the location and the optimal DX windows from Central Europe.
Typical DX windows from Austria:
- Japan/East Asia: Mornings (06–09 UTC) on 20 m and 15 m, evenings (16–19 UTC) on 20 m via long path
- North America: Afternoon to evening (14–22 UTC) on 20 m and 15 m, during solar maximum also on 10 m and 12 m
- Australia/Oceania: Difficult but possible via long path in the morning (08–12 UTC) on 20 m
- South America: Evenings (18–22 UTC) on 20 m and 15 m, grey-line openings on 40 m and 80 m
HamClock visualises these windows automatically — instead of calculating them mentally, you can see at a glance which paths are currently or soon to be open.
Alternatives to HamClock
HamClock is the most polished dedicated shack dashboard, but alternatives exist:
- Web-based dashboards: Websites such as dxheat.com (DX cluster with map), hamqsl.com/solar (solar data widgets) or qrz.com can run as permanent browser tabs. Advantage: no installation. Disadvantage: no unified, optimised interface.
- Smartphone apps: Apps such as "HamAlert" (DX spots as push notifications), "Solar Ham" (solar data) or "ISS Detector" (satellites) offer individual features on the go. A good supplement for portable operation during SOTA or POTA.
- Grafana dashboards: Technically minded hams build their own dashboards with Grafana, aggregating data from various APIs (NOAA, DX cluster, own sensors) and presenting it as attractive charts. Maximum flexibility, but considerable configuration effort.
- DXLab Suite / Log4OM: Some logging programs offer integrated propagation information — though as part of a larger application, not as a dedicated dashboard.
Hardware Costs and Setup
A dedicated HamClock setup is surprisingly affordable:
- Raspberry Pi 4 or 5: around 50–70 euros (2 GB RAM is perfectly sufficient for HamClock)
- Official 7-inch touchscreen display: around 40–50 euros
- Case with stand: around 10–20 euros (there are special cases that integrate RPi and display)
- SD card (32 GB): around 8–10 euros
- Power supply: around 10 euros (official RPi power supply recommended)
Total cost: around 100–150 euros for a complete, dedicated shack dashboard. Alternatively, HamClock can of course run on an existing PC or laptop — then no additional costs arise.
For larger displays, an HDMI monitor (10 inches or bigger) is worthwhile. Some hams use retired tablets with the web interface — HamClock offers a web server option that lets you view the dashboard in the browser from any device on the network.
Tips for Optimal Use
- Fixed placement: The dashboard should always be in your line of sight — ideally directly beside or above the transceiver. Many hams mount the RPi display with a VESA bracket or swing arm.
- Automatic start: Set HamClock to launch at system boot (autostart entry or systemd service). The dashboard is then ready immediately when you power on the Raspberry Pi.
- Disable screen saver: So the display stays on permanently rather than going black after a few minutes.
- Regular updates: WB0OEW frequently releases new versions with additional features and bug fixes. An update takes just a few minutes.
- Use the web interface: Even with a dedicated display, the web interface allows access from a smartphone or laptop — handy when you are not sitting directly at the shack.
Video tip: a complete setup for around 60 dollars, step by step.

Conclusion: A Must-Have for Every Shack
HamClock and OpenHamClock are the best free shack dashboards available. For around 100 euros, a Raspberry Pi and a small touchscreen give you a dedicated information display showing all relevant data for radio operation at a glance. No other solution offers so much information in such a compact, well-thought-out presentation — from propagation conditions and the DX cluster to VOACAP predictions and POTA/SOTA spots.
Once you have worked with HamClock, you will not want to be without it — it quickly becomes an indispensable part of the station.
73 – your oeradio.at editorial team
Sources and further reading
- hamclock.com — community backend by W4BAE, downloads and the switch command
- Amateur Radio Newsline: Silent Key Elwood Downey, WB0OEW (30 January 2026)
- HamClock-Next on GitHub (C++20/SDL2, K4DRW)
- OpenHamClock on GitHub (Node.js/React)
- openhamclock.oeradio.at — our open instance to try out
- Dockerised HamClock (multi-arch container)
- NOAA Space Weather Prediction Center — the source behind SFI, K and A index
- PSK Reporter — real-time propagation map
Image credits
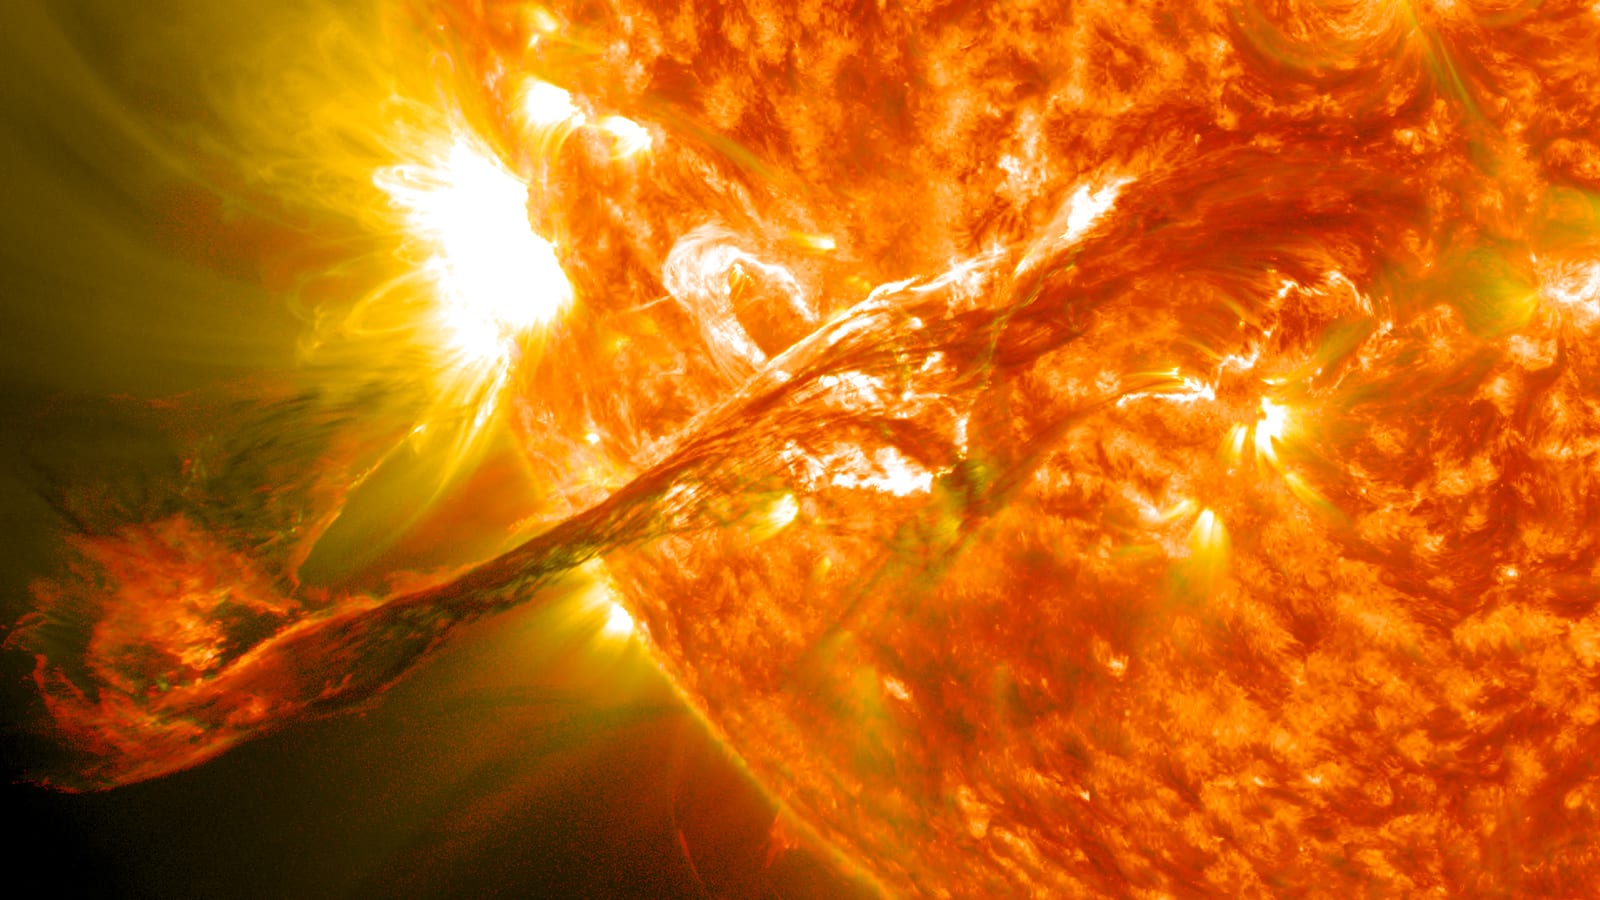
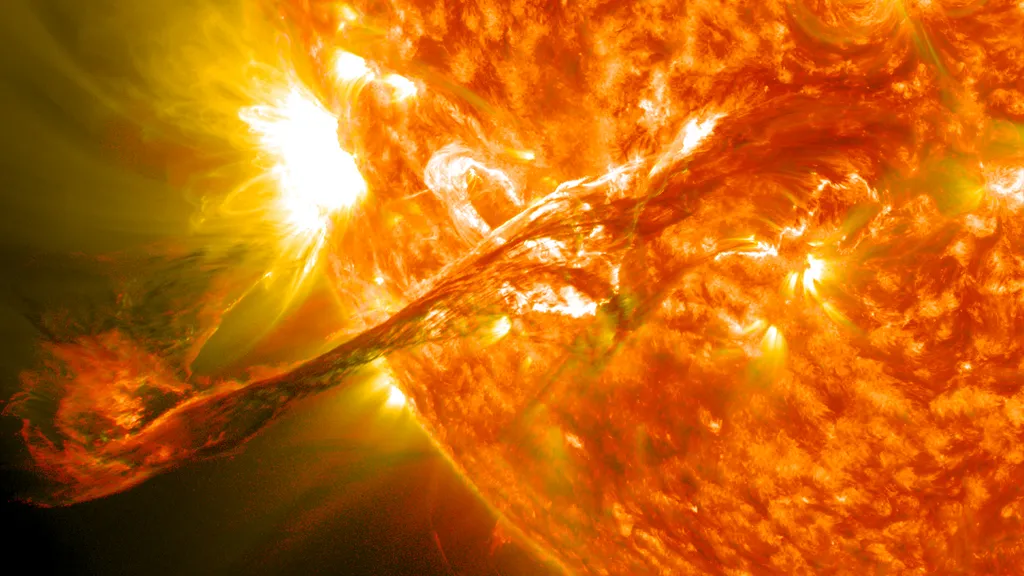
- Coronal mass ejection: NASA Goddard Space Flight Center, CC BY 2.0, Wikimedia Commons
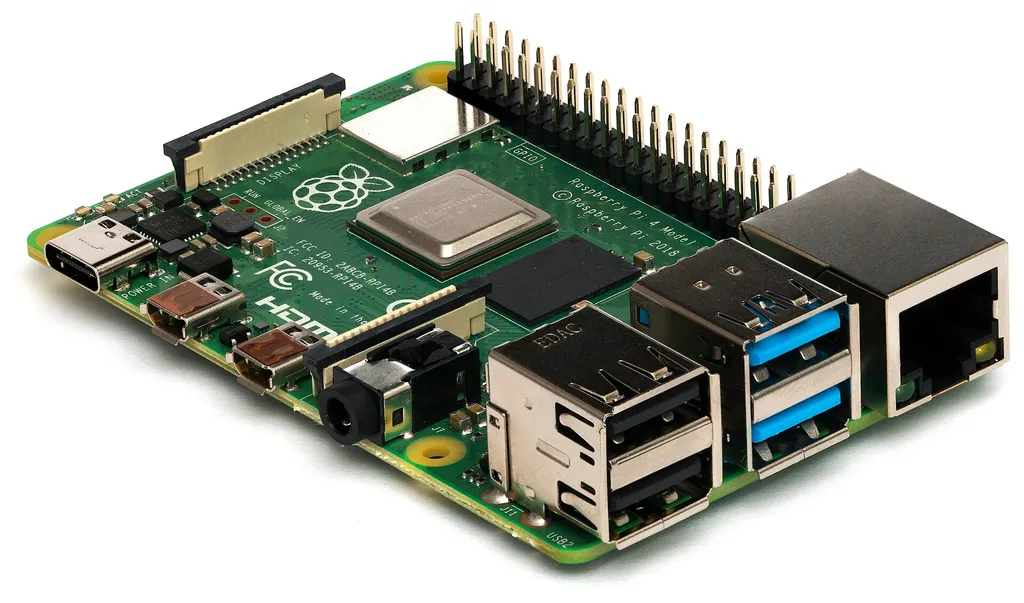
- Raspberry Pi 4 Model B: Laserlicht, CC BY-SA 4.0, Wikimedia Commons
- Earth at night: NASA Earth Observatory, public domain, Wikimedia Commons
Videos: HamTech M0FXB, KM6LYW Radio. Embedded via YouTube; rights remain with the respective channels.
Correction notice
Update of 3 October 2026: the first version of this article described HamClock as a project under "continuous development" and pointed to clearskyinstitute.com for downloads. Neither holds since 2026: Elwood Downey, WB0OEW, died on 29 January 2026, version 4.22 is his last, and his server went offline in June 2026. The article now names the community server hamclock.com including the switch command and introduces HamClock-Next as a second successor. OpenHamClock was also wrongly labelled a "community fork"; it is an independent reimplementation in Node.js and React with no shared code. The platform note has been corrected too: microcontroller support for the ESP8266 was dropped with version 4. The title image is now a free NASA photo instead of an AI illustration.
Transparency Notice
This article was researched and written with the assistance of AI (Claude, Anthropic). The editorial team has reviewed and edited all content. Despite careful review, occasional inaccuracies may occur — we welcome corrections via email to [email protected].