Table of Contents
- Solar Flux Index (SFI) – The Engine of Propagation
- What do the SFI values mean?
- K-Index and Kp-Index – The Geomagnetic Weather
- What do the Kp values mean?
- A-Index and Ap-Index – The Daily Summary
- Sunspot Number (SSN)
- Other Important Indicators
- Bz Component of the Interplanetary Magnetic Field (IMF)
- Solar Flares
- Proton Events and Polar Cap Absorption (PCA)
- The Best Websites and Apps
- Official Data Sources
- Amateur Radio-Specific Tools
- Practical Strategy: How to Use the Data
- 1. Check SFI – Which Bands Are Viable?
- 2. Check Kp-Index – How Stable Is the Ionosphere?
- 3. Watch Bz Direction
- 4. Use Seasonal Patterns
- 5. Use Gray Line
- Conclusion
- Useful Links
“What are the conditions like today?” – every amateur radio operator asks themselves this question before going on the bands. The answer lies in a handful of key indicators: SFI, K-Index, A-Index, and sunspot number. Those who understand these indices can specifically choose the best bands and times for DX – instead of blindly tuning around and hoping for luck. In this article, we explain what’s behind the numbers and how to use them practically.
Solar Flux Index (SFI) – The Engine of Propagation
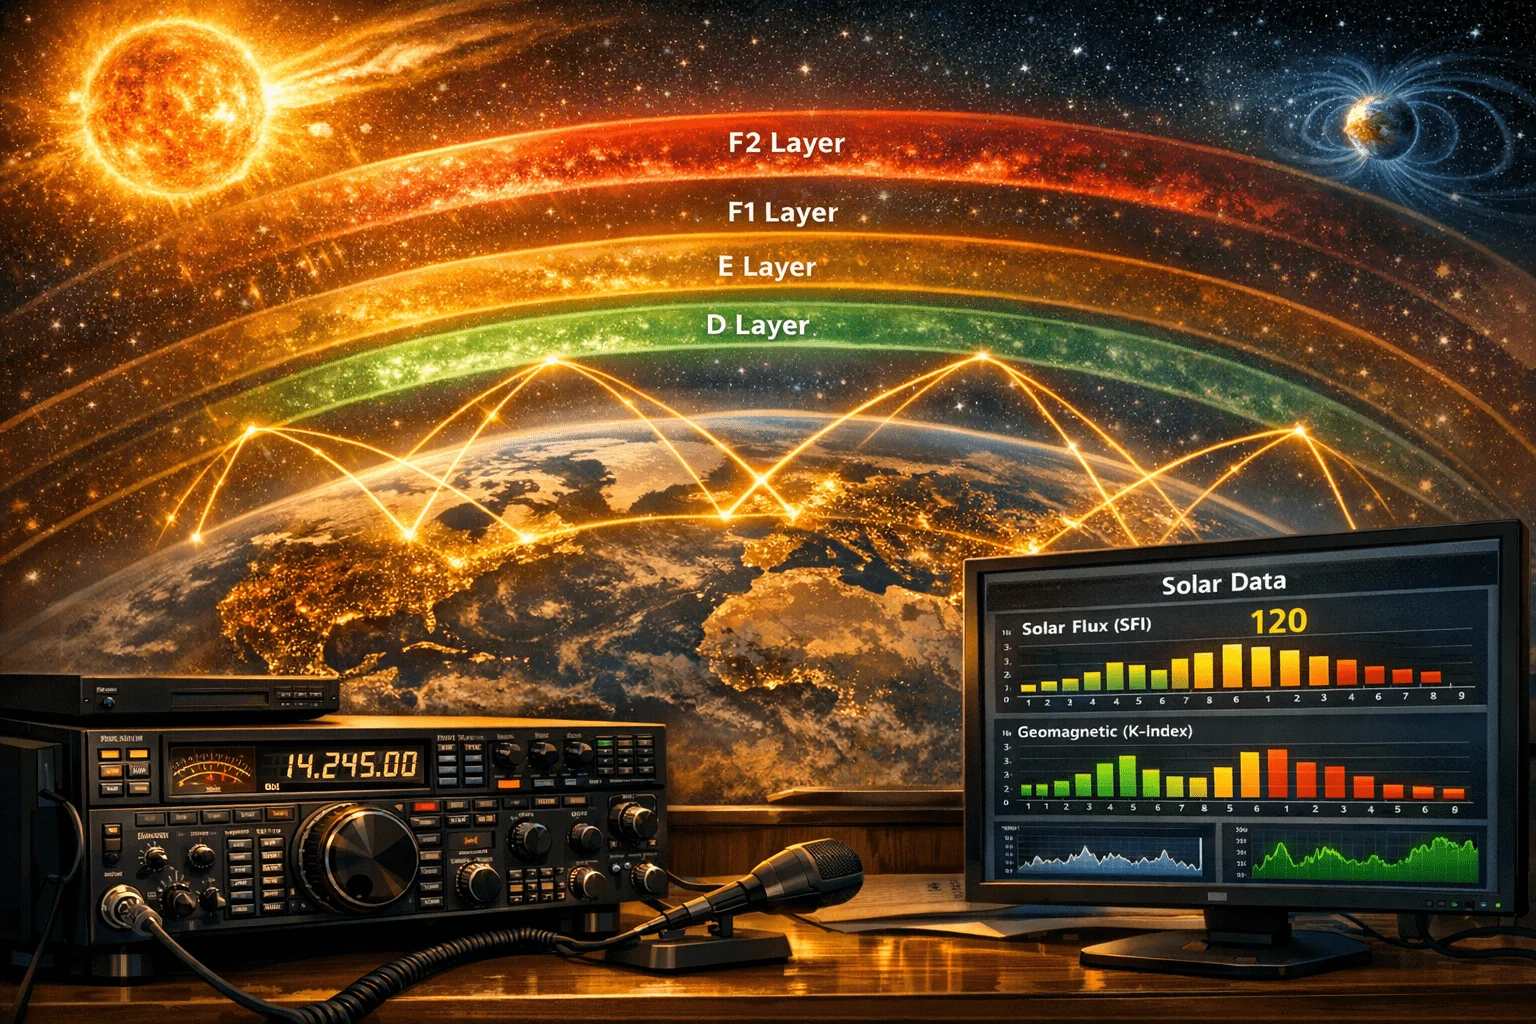
The Solar Flux Index is the most important indicator for HF propagation. It measures the radio emission of the sun at 2800 MHz (10.7 cm wavelength) and is expressed in Solar Flux Units (SFU). Measurements are taken daily at the Dominion Radio Astrophysical Observatory in Penticton, Canada – one of the longest uninterrupted measurement series of solar activity.
Why is the SFI so important? Because it directly correlates with the UV radiation from the sun that charges the ionosphere. More solar radiation means stronger ionization of the F2 layer, which increases the Maximum Usable Frequency (MUF) – that is, the highest frequency still reflected by the ionosphere.
What do the SFI values mean?
- Below 70 SFU: Poor conditions – the high bands (10m, 12m, 15m) are mostly closed. Only the lower bands (40m, 80m, 160m) work reliably.
- 70–100 SFU: Average conditions – 20m works well, 15m and 17m open occasionally.
- 100–150 SFU: Good conditions – 15m becomes regularly usable, 12m and 10m show first openings.
- 150–200 SFU: Very good conditions – 10m becomes a daily DX band!
- Above 200 SFU: Excellent – even 6m can open via the F2 layer.
Important: The lower bands (40m, 80m, 160m) are hardly affected by the SFI. They work even with low SFI, as they use the E layer and lower F layer, which require less ionization.
Currently (March 2026), the SFI is around 135 SFU. Solar Cycle 25 reached its peak in October 2024 with a smoothed sunspot number of 160.9 – significantly higher than the original prediction of 115. Although we are in the descending phase, conditions on the high bands are still good.
K-Index and Kp-Index – The Geomagnetic Weather
While the SFI determines the “basic energy” of the ionosphere, the K-Index shows how quiet or disturbed the Earth’s magnetic field currently is. The “K” stands for the German word Kennziffer (characteristic number) – the index was introduced in 1938 by German geophysicist Julius Bartels.
The K-Index is measured every 3 hours at magnetometer stations and has a quasi-logarithmic scale from 0 to 9. The Kp-Index (planetary characteristic number) is the weighted average from 13 geomagnetic observatories worldwide – including Niemegk in Brandenburg, operated by the GFZ Helmholtz Centre Potsdam.
What do the Kp values mean?
- Kp 0–1: Quiet – optimal conditions for HF propagation
- Kp 2–3: Slightly unsettled – generally still good conditions
- Kp 4: Active – noticeable deterioration, especially on polar paths
- Kp 5 (G1 storm): Minor geomagnetic storm – HF fading on the dayside
- Kp 6 (G2): Moderate storm – outages at higher latitudes
- Kp 7 (G3): Strong storm – HF connections intermittent
- Kp 8–9 (G4/G5): Severe to extreme storm – HF propagation may be impossible for 1–2 days
Geomagnetic storms cause increased absorption in the D layer, auroral effects, and an irregular F layer. High-latitude paths (e.g., to Scandinavia, Canada, or Japan over the pole) are always affected first and most severely.
A-Index and Ap-Index – The Daily Summary
The A-Index is the daily average of geomagnetic activity. It is calculated from the eight three-hourly K values of a day via a conversion table and has a linear scale from 0 to 400. The Ap-Index is the planetary A-Index.
The linear scale makes the A-Index ideal for long-term comparisons and trend analyses:
- Ap 0–7: Quiet – excellent HF conditions
- Ap 8–15: Slightly unsettled – good conditions
- Ap 16–29: Active – some impairment possible
- Ap 30–49: Minor storm – significant deterioration
- Ap 50–99: Major storm – HF significantly disturbed
- Ap above 100: Severe/extreme storm – HF operation severely limited
Sunspot Number (SSN)
The International Sunspot Number (also Wolf number, after Rudolf Wolf, who standardized it in 1849) is provided by the SIDC (Solar Influences Data Centre) at the Royal Observatory of Belgium in Brussels. The formula is: R = k × (10g + s), where g is the number of sunspot groups and s is the number of individual spots.
Important for practical purposes: The smoothed sunspot number (13-month average) filters out short-term fluctuations and shows the trend of the solar cycle. The current Solar Cycle 25 has significantly exceeded expectations:
- Beginning: December 2019 (minimum at SSN 1.8)
- Peak: October 2024 (smoothed SSN 160.9 – 40% above the prediction)
- Current (Feb. 2026): Monthly average around ~97 – declining, but still at a good level
- Next minimum: Expected around 2030–2031
Other Important Indicators
Bz Component of the Interplanetary Magnetic Field (IMF)
The Bz component is possibly the most important short-term indicator. When Bz points south (negative values), the solar wind magnetic field couples to Earth’s magnetosphere and drives geomagnetic storms. Bz positive (northward) = quiet conditions. Bz strongly negative (below -10 nT) = deterioration expected, even if Kp is still low.
Solar Flares
Flares are classified by their X-ray intensity (measured by GOES satellites). Each class is 10 times stronger than the previous one:
- A, B, C class: No or minimal impact on HF
- M class: Short-term HF fade on the dayside (R1–R2, minutes to tens of minutes)
- X class: Severe to total HF blackout on the dayside (R3–R5, up to several hours)
Proton Events and Polar Cap Absorption (PCA)
High-energy protons from the sun can ionize the D layer over the polar caps and cause total HF blackout there – the dreaded polar cap absorption. PCA events can last several days and make transpolar radio communications impossible. Even airlines must divert their polar routes during PCA.
The Best Websites and Apps
Here are the most important sources for real-time propagation data:
Official Data Sources
- NOAA Space Weather Prediction Center – The authoritative source for space weather data and forecasts: Kp-Index, SFI, X-ray flux, solar wind, 3-day forecasts
- GFZ Potsdam Kp-Index – Official Kp-Index service of the Helmholtz Centre
- SIDC/SILSO – Official sunspot numbers (Royal Observatory of Belgium)
Amateur Radio-Specific Tools
- HamQSL / N0NBH Solar Banners – The most widespread propagation banners in amateur radio. SFI, Kp, band conditions at a glance. Embedded on thousands of ham websites.
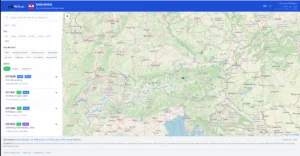
- KC2G MUF Map – Real-time map of MUF(3000km) based on ionosonde data worldwide. Updated every 15 minutes – indispensable!
- PSK Reporter – Real-time visualization of FT8/FT4/WSPR spots worldwide. Shows which bands are currently open – better than any prediction.
- VOACAP Online – The gold standard for HF propagation predictions. Originally developed for Voice of America, now freely available.
- DXHeat – DX cluster with band activity graphs and propagation overview
- DR2W DX Propagation – High-resolution SNR maps, calculated with VOACAP (German site)
- SolarHam – Daily updates on solar flares, storms, and blackouts
- SpaceWeatherLive – Comprehensive solar and auroral data with push notifications (also as app)
- OpenHamClock – Open-source dashboard with DX cluster, propagation, gray line, satellite tracking
Practical Strategy: How to Use the Data
Here’s a concrete roadmap for every radio operation:
1. Check SFI – Which Bands Are Viable?
- SFI below 80: Focus on 40m, 30m, 20m
- SFI 80–120: 20m reliable, try 17m and 15m
- SFI 120–150: 15m good, 12m and 10m open occasionally
- SFI above 150: All bands possible, 10m can be excellent
2. Check Kp-Index – How Stable Is the Ionosphere?
- Kp 0–2: Excellent – all paths should work
- Kp 3–4: Good to fair – polar paths possibly disturbed
- Kp 5+: Avoid high-latitude paths; prefer lower bands
3. Watch Bz Direction
When Bz points strongly south (below -10 nT), expect deterioration – even if Kp is currently still low. Bz is the best early indicator of coming storms.
4. Use Seasonal Patterns
- Equinoxes (March/September): The best HF conditions of the year! Equal illumination of both hemispheres, optimal MUF values.
- Winter: Excellent for the lower bands (80m, 160m) thanks to long nights. The F2-MUF is paradoxically higher in winter than in summer (the so-called “winter anomaly”).
- Summer: Sporadic E layer can open 10m, 6m, and even 2m for short periods. 20m stays open longer in the evening.
5. Use Gray Line
Along the twilight line (terminator), the absorbing D layer disappears quickly at sunset, while it hasn’t yet formed at sunrise. This creates a “channel” with extremely low absorption – ideal for DX on 30m, 40m, 80m, and 160m. You get the best results when both you and the other station are in the gray line.
Conclusion
Propagation indices aren’t abstract science – they’re the DXer’s daily toolkit. A quick look at SFI, Kp, and Bz before operating takes 30 seconds and saves hours of fruitless CQ calling.
The golden rule: High SFI + low Kp = best conditions. And the best news for anyone reading this article in March 2026: We’re right at the equinox – statistically the best time of year for HF DX. So: Get on the bands!
Useful Links
- NOAA Space Weather Prediction Center
- HamQSL Solar Banners (N0NBH)
- KC2G Real-time MUF Map
- PSK Reporter
- VOACAP Online
- SpaceWeatherLive
- GFZ Potsdam Kp-Index
- SolarHam
- OpenHamClock
73 – your oeradio.at editorial team
Transparency Notice
This article was researched and written with the assistance of AI (Claude, Anthropic). Any illustrations used were generated with AI (ChatGPT/DALL·E, OpenAI) unless otherwise noted. All facts have been verified to the best of our knowledge — for current propagation data, we recommend consulting the linked real-time sources.